
If you have ever used the Hailo-8 AI acceleration module, you may have used its integrated on-board telemetry for measuring power and temperature. It is fully integrated into their API, and just works out of the box, making benchmarking easy and reproducible.
Unfortunately, not all AI accelerator vendors have this functionality available. Some only measure temperature, others nothing at all.
In this series, we will explore how to achieve a similar level of power measurement independently.
Series: Edge AI Power Benchmarking
But first, let’s dive into Hailo’s power and temperature monitoring solution.
Hailo’s Power Measurement Solution
Hailo has included an INA device on-board the Hailo-8 M.2 acceleration module. This allows the host to measure power across a shunt resistor that is placed in series with the power rail.
From my personal observations and research, I’m guessing that the device is a Texas Instruments INA231, for the following reasons:
- it has a 1.8V-compatible I2C interface, which would match the Hailo-8’s 1.8V I/O
- it supports 0-28V sensing from a 3.3V supply, which is the voltage available on M.2 modules
- it is available in a very small package
Whether I have this correct or not is not really important for this discussion.
This functionality is available via their Python API:
It is also available via their hailortcli utility with the benchmark sub-command, as we will see in the next section.
Reproducing the Hailo Model Zoo throughput benchmark results
If we run a benchmark on the resnet50 model:
(hailo_virtualenv) $ wget https://hailo-model-zoo.s3.eu-west-2.amazonaws.com/ModelZoo/Compiled/v2.18.0/hailo8/resnet_v1_50.hef
--2026-05-01 11:32:40--  https://hailo-model-zoo.s3.eu-west-2.amazonaws.com/ModelZoo/Compiled/v2.18.0/hailo8/resnet_v1_50.hef
Resolving hailo-model-zoo.s3.eu-west-2.amazonaws.com (hailo-model-zoo.s3.eu-west-2.amazonaws.com)... 3.5.245.56, 52.95.150.158, 52.95.143.110, ...
Connecting to hailo-model-zoo.s3.eu-west-2.amazonaws.com (hailo-model-zoo.s3.eu-west-2.amazonaws.com)|3.5.245.56|:443... connected.
HTTP request sent, awaiting response... 200 OK
Length: 17978284 (17M) [binary/octet-stream]
Saving to: ‘resnet_v1_50.hef’

resnet_v1_50.hef      100%[=======================>]  17.14M  7.39MB/s    in 2.3s

2026-05-01 11:32:43 (7.39 MB/s) - ‘resnet_v1_50.hef’ saved [17978284/17978284]
We can not only reproduce the Hailo Model Zoo benchmarks, but also measure the power consumption of the Hailo-8 in our local system.
(hailo_virtualenv) $ hailortcli benchmark resnet_v1_50.hef
Starting Measurements...
Measuring FPS in HW-only mode
Network resnet_v1_50/resnet_v1_50: 100% | 20577 | FPS: 1371.25 | ETA: 00:00:00
Measuring FPS (and Power on supported platforms) in streaming mode
[HailoRT] [warning] Using the overcurrent protection dvm for power measurement will disable the overcurrent protection.
If only taking one measurement, the protection will resume automatically.
If doing continuous measurement, to enable overcurrent protection again you have to stop the power measurement on this dvm.
Network resnet_v1_50/resnet_v1_50: 100% | 20580 | FPS: 1371.43 | ETA: 00:00:00
Measuring HW Latency
Network resnet_v1_50/resnet_v1_50: 100% | 3685 | HW Latency: 3.39 ms | ETA: 00:00:00

=======
Summary
=======
FPS     (hw_only)                 = 1371.26
        (streaming)               = 1371.44
Latency (hw)                      = 3.39388 ms
Device 0000:c6:00.0:
  Power in streaming mode (average) = 3.96043 W
                          (max)     = 3.98996 W
(hailo_virtualenv) $ hailortcli benchmark resnet_v1_50.hef
Starting Measurements...
Measuring FPS in HW-only mode
Network resnet_v1_50/resnet_v1_50: 100% | 20577 | FPS: 1371.26 | ETA: 00:00:00
Measuring FPS (and Power on supported platforms) in streaming mode
[HailoRT] [warning] Using the overcurrent protection dvm for power measurement will disable the overcurrent protection.
If only taking one measurement, the protection will resume automatically.
If doing continuous measurement, to enable overcurrent protection again you have to stop the power measurement on this dvm.
Network resnet_v1_50/resnet_v1_50: 100% | 20580 | FPS: 1371.44 | ETA: 00:00:00
Measuring HW Latency
Network resnet_v1_50/resnet_v1_50: 100% | 3648 | HW Latency: 3.39 ms | ETA: 00:00:00

=======
Summary
=======
FPS     (hw_only)                 = 1371.27
        (streaming)               = 1371.45
Latency (hw)                      = 3.38907 ms
Device 0000:c6:00.0:
  Power in streaming mode (average) = 4.06172 W
                          (max)     = 4.09325 W
We have faithfully reproduced the 1372 FPS benchmark published by Hailo. The benchmarking utility conducts three phases:
| Phase | Measures | Description |
|---|---|---|
| HW only | FPS | How fast is the Hailo chip alone? |
| Streaming | FPS + Power | How fast (and power-hungry) is the full system? Includes pre-infer and post-infer steps on the host. |
| HW Latency | FPS | How long does a single frame take through the hardware? |
Thermal Considerations
You should have noticed in the previous section that the two runs produced the same throughput, but different power consumption values (3.96 W versus 4.06 W).
This is due to temperature. The hotter the Hailo-8 silicon gets, and the more power it draws to sustain the same workload.
Hailo’s API also includes temperature monitoring. This is implemented directly inside their Hailo-8 chip, which exposes two on-die thermal sensors:
- TS0
- TS1
In the next section, we will use the Python API to capture power and temperature measurements ourselves, in order to understand the details of what is going on.
Thermal Throttling
Hailo defines three operating zones based on internal temperature.
| Zone | Condition | Behavior |
|---|---|---|
| Green Zone | T < 104°C | Normal operation, no throttling |
| Orange Zone | 104°C ≤ T < 120°C | Frequency throttling active (if enabled), performance reduced from 100% down to 50% |
| Red Zone | T ≥ 120°C | Not safe for operation => input/output streams are shut down. New streams cannot be opened. |
Two Protection Mechanisms are provided:
Temperature Throttling – May be disabled, but it is strongly recommended to keep it enabled. When active, the firmware gradually reduces the internal clock frequency as temperature rises into the Orange Zone.
Over-Temperature Protection (AMR) – Always on. Kicks in when the Red Zone threshold is reached, forcibly shutting down streams.
Measuring Hailo-8 Power and Temperature with mb-powermon.py
The first step is to clone the repo for my open-source power monitoring utility.
Creating a power measurement utility may seem superfluous when Hailo’s API already provides everything we need. However, since the next articles explore alternate methods of measuring power, having a single common utility across them will make comparison easier.
(hailo_virtualenv) $ git clone https://github.com/AlbertaBeef/mb-powermon

(hailo_virtualenv) $ cd mb-powermon
Next, we can launch this utility as follows:
(hailo_virtualenv) $ python3 mb-powermon.py --probe hailo --csv mb-powermon-hailo-resnet50-20260501.csv
If we re-run the hailortcli utility in a separate console within the Hailo docker container:
(hailo_virtualenv) $ hailortcli benchmark resnet_v1_50.hef -s 0000:c6:00.0
Starting Measurements...
Measuring FPS in HW-only mode
Network resnet_v1_50/resnet_v1_50: 100% | 20578 | FPS: 1371.33 | ETA: 00:00:00
Measuring FPS (and Power on supported platforms) in streaming mode
[HailoRT] [warning] Using the overcurrent protection dvm for power measurement will disable the overcurrent protection.
If only taking one measurement, the protection will resume automatically.
If doing continuous measurement, to enable overcurrent protection again you have to stop the power measurement on this dvm.
Network resnet_v1_50/resnet_v1_50: 100% | 20580 | FPS: 1371.43 | ETA: 00:00:00
Measuring HW Latency
Network resnet_v1_50/resnet_v1_50: 100% | 3674 | HW Latency: 3.39 ms | ETA: 00:00:00

=======
Summary
=======
FPS     (hw_only)                 = 1371.34
        (streaming)               = 1371.45
Latency (hw)                      = 3.38976 ms
Device 0000:c6:00.0:
  Power in streaming mode (average) = 4.05882 W
                          (max)     = 4.05882 W
(hailo_virtualenv) $ hailortcli benchmark resnet_v1_50.hef -s 0000:c4:00.0
Starting Measurements...
Measuring FPS in HW-only mode
Network resnet_v1_50/resnet_v1_50: 100% | 20557 | FPS: 1369.90 | ETA: 00:00:00
Measuring FPS (and Power on supported platforms) in streaming mode
[HailoRT] [warning] Using the overcurrent protection dvm for power measurement will disable the overcurrent protection.
If only taking one measurement, the protection will resume automatically.
If doing continuous measurement, to enable overcurrent protection again you have to stop the power measurement on this dvm.
Network resnet_v1_50/resnet_v1_50: 100% | 20581 | FPS: 1371.45 | ETA: 00:00:00
Measuring HW Latency
Network resnet_v1_50/resnet_v1_50: 100% | 4346 | HW Latency: 3.19 ms | ETA: 00:00:00

=======
Summary
=======
FPS     (hw_only)                 = 1369.94
        (streaming)               = 1371.46
Latency (hw)                      = 3.18778 ms
Device 0000:c4:00.0:
  Power in streaming mode (average) = 3.90771 W
                          (max)     = 3.90962 W
While this is running, you will see something similar to the following (video playing at 4x speed):
In this video, I have two Hailo modules connected to my AMD Strix Halo PC:
- 0000:c6:00.0: Hailo-8 M-Key module connected to a 4 lane PCIe slot
- 0000:c4:00.0: Hailo-8 M-Key module connected to a 1 lane M.2 slot
I ran the same test on both modules, with similar throughput results.
If we convert the output .csv file to a user friendly .html, we can plot power and temperature for both runs and overlay Hailo’s reported averages:
(hailo_virtualenv) $ python3 csv-to-html-plot.py --input mb-powermon-hailo-resnet50-20260501.csv --output mb-powermon-hailo-resnet50-20260501.html
I wouldn’t read too much into the exact temperature values, as this depends on your system, the thermal solution you are using, and how well ventilated your system is.
I am using simple passive heat sinks, as shown below:
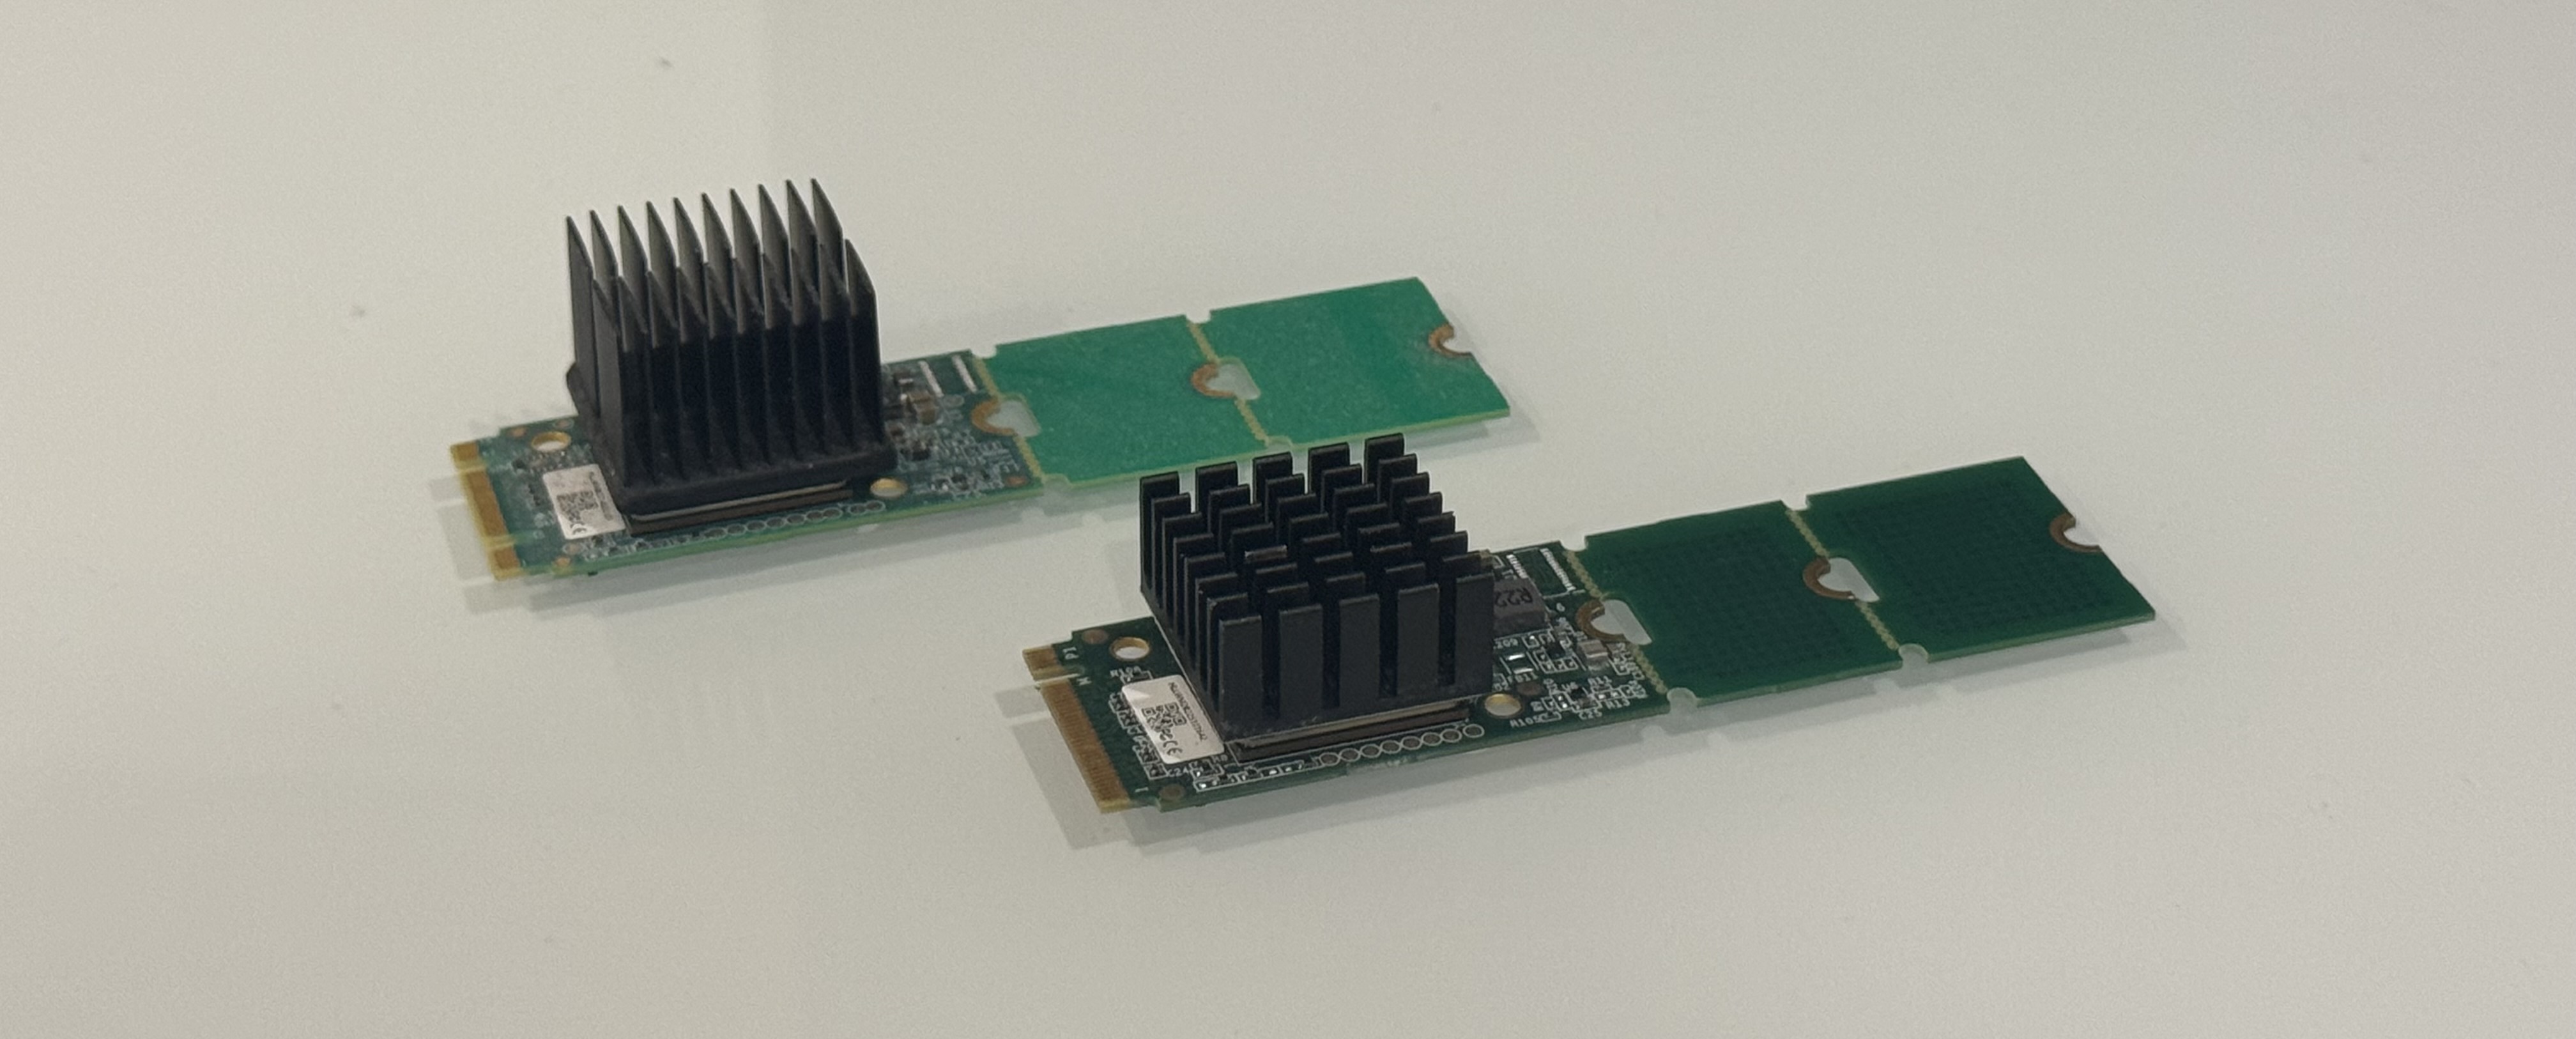
In my case, the temperature for the first Hailo-8 module is higher simply because I had made several test runs on it before taking the readings.
The main takeaway is that in order to benchmark the Hailo-8 module in your specific system, you should “warm up” the Hailo-8 module, and let its temperature stabilize before taking power measurements.
Idle Power
For power-sensitive applications, it is useful to know what the Hailo-8 module draws when it is powered up but not running inference. I have measured two distinct idle power levels across the systems I have tested:
- 0.84 W on a system with ASPM disabled at the platform level
- 0.51 W on a system with ASPM L1 active
This ~300 mW gap is specific to the different platforms. The Hailo-8 module behaves identically in both cases — same firmware, same driver, same chip. The difference comes from how the host platform manages the PCIe link.
What is ASPM ?
Active-State Power Management is a PCIe feature that lets an idle link drop into a low-power state (L1) and wake back up on demand. When ASPM is active, the SerDes PHY at both ends of the link can power down significant portions of itself between transactions, saving hundreds of milliwatts on a PCIe link. When ASPM is disabled, the link stays in its fully-active state (L0) continuously, even when no data is flowing — which is where that extra 300 mW comes from.
For ASPM to be active, both ends of the link must advertise support and have it enabled. The endpoint side is the Hailo, and it always supports ASPM (this is implemented in the chip itself). The other end is the host’s PCIe root port, and that’s where the variation lives.
For convenience, I display the status of the ASPM in the mb-powermon.py utility.
Known Issues
The warning displayed by the Hailo API merits some attention:
[HailoRT] [warning] Using the overcurrent protection dvm for power measurement will disable the overcurrent protection.
If only taking one measurement, the protection will resume automatically.
If doing continuous measurement, to enable overcurrent protection again you have to stop the power measurement on this dvm.
Measuring power with the Hailo API, while hailortcli is running a benchmark, should be avoided, and can cause collisions, which can result in incorrect measurements, as shown below:
(hailo_virtualenv) $ hailortcli benchmark resnet_v1_50.hef -s 0000:c6:00.0
Starting Measurements...
Measuring FPS in HW-only mode
Network resnet_v1_50/resnet_v1_50: 100% | 20577 | FPS: 1371.26 | ETA: 00:00:00
Measuring FPS (and Power on supported platforms) in streaming mode
[HailoRT] [warning] Using the overcurrent protection dvm for power measurement will disable the overcurrent protection.
If only taking one measurement, the protection will resume automatically.
If doing continuous measurement, to enable overcurrent protection again you have to stop the power measurement on this dvm.
Network resnet_v1_50/resnet_v1_50: 100% | 20580 | FPS: 1371.46 | ETA: 00:00:00
Measuring HW Latency
Network resnet_v1_50/resnet_v1_50: 100% | 3758 | HW Latency: 3.38 ms | ETA: 00:00:00

=======
Summary
=======
FPS     (hw_only)                 = 1371.27
        (streaming)               = 1371.47
Latency (hw)                      = 3.3756 ms
Device 0000:c6:00.0:
  Power in streaming mode (average) = 0 W
                          (max)     = 0 W
A subtler symptom of the same problem, that you may have spotted in my previous results: when contention is partial rather than total, hailortcli may report identical “average” and “max” values to many decimal places, which is not what real sampled statistics look like.
The takeaway is that only one application should be using the Hailo API to measure power at a time.
Conclusion
In this article, we have seen the ease of use of Hailo’s power monitoring solution.
In the next articles, we will try to reproduce similar power monitoring, in order to have an independent solution with which to measure the M.2 AI accelerator modules from other vendors.